The Advent of Computer Based Mapping
History is written by the victors.
So said Winston Churchill. Or at least he is said to have said it. Whether or not he actually said it is up for debate. The background story is a tad more complicated.
Regardless the quote is apropos to this week’s episode of Map Happenings.
If do you a little research on the advent of computer based mapping all roads appear to point in the same direction. And that direction seems to be towards an English chap who in 1933 was born in Cambridge (England — not Massachusetts you fool!) His name is Tomlinson, Dr. Roger Frank Tomlinson.

As many of you mapping nerds will know it is Roger who has been anointed the “Father of GIS”. If you’re not a mapping nerd then you may be wondering what that particular TLA1 stands for. The answer is “Geographic Information System”.
According to Encyclopedia Brittanica (yes, it still exists) an information system is “an integrated set of components for collecting, storing, and processing data and for providing information, knowledge, and digital products”. According to the National Institute of Standards and Technology (NIST, part of the U.S. Department of Commerce) the definition for an information system are many, but probably the most succinct is “A discrete set of resources organized for the collection, processing, maintenance, use, sharing, dissemination, or disposition of information”.
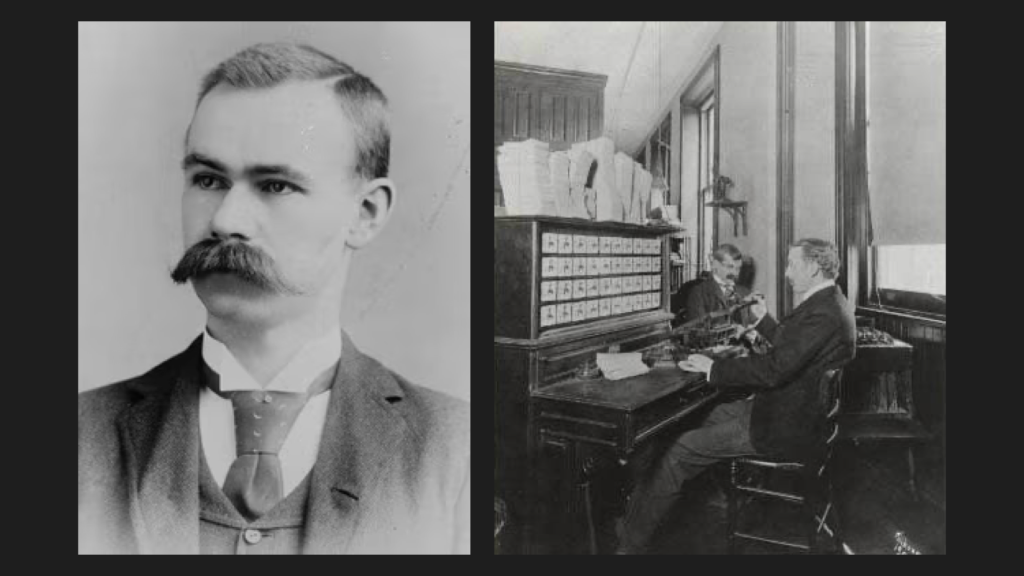
One of the first mechanical information systems was the tabulator that Herman Hollerith invented to process the results of the 1890 U.S. Census. His invention came as a result of a competition the U.S. Census Bureau held in 1888 to find a more efficient method to process and tabulate census data. Hollerith won.

This mechanical marvelry continued to evolve and be employed for processing census data for five decades, right up until 1940. Then in 1943 the U.S. National Defense Research Council (NDRC) approved the design and construction of the Electronic Numeric Integrator and Computer (ENIAC). It was during the development of ENIAC that the Census Bureau started to explore the use of the technology for their own purposes. The final result of this study were specifications for the Universal Automatic Computer (UNIVAC).
For a computer nerd like me I find the story fascinating. Here’s the history as described by the U.S. Census Bureau:
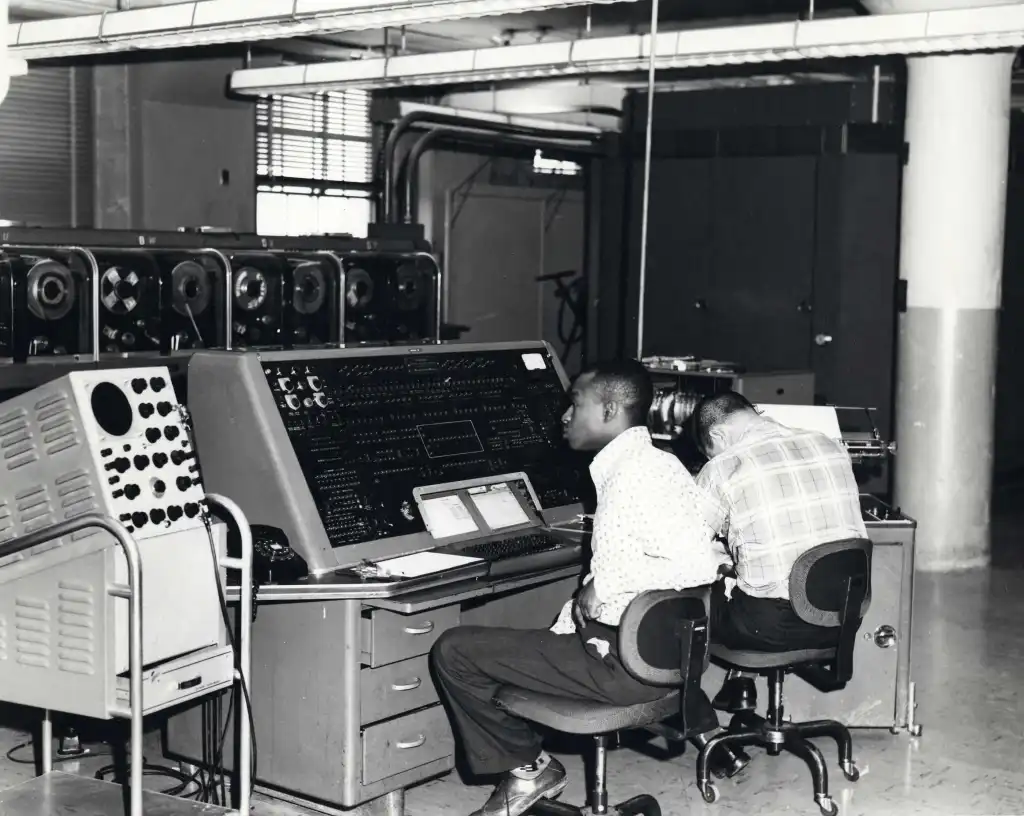
UNIVAC was, effectively, an updated version of ENIAC. Data could be input using magnetic computer tape (and, by the early 1950’s, punch cards). It was tabulated using vacuum tubes and state-of-the-art circuits then either printed out or stored on more magnetic tape.
UNIVAC I [was built] in 1948 and a contract for the machine was signed by the Census Bureau on March 31, 1951, and a dedication ceremony was held in June of that year. UNIVAC I was soon used to tabulate part of the 1950 population census and the entire 1954 economic census. Throughout the 1950’s, UNIVAC also played a key role in several monthly economic surveys. The computer excelled at working with the repetitive but intricate mathematics involved in weighting and sampling for these surveys.
UNIVAC I, as the first successful civilian computer, was a key part of the dawn of the computer age. Despite early delays, the UNIVAC program at the Census Bureau was a great success.

I have to say, kudos to the U.S. Census Bureau. Time and time again they have shown their prowess with technology and with mapping systems. Their work was pioneering in many ways I’d frankly I’m surprised that they didn’t beat the rest of the world to inventing the world’s first geographic information system.
But there again, it’s back to “history is written by the victors”.
And so it’s back to old Roger.
In 1951 Roger started his career as a pilot in the Royal Air Force, but at 6’7″ (2m) was promptly warned he was too tall for the ejector seats. Should he have been ejected his legs would have been left behind. Rather than run the risk of becoming legless he instead chose academics. Having now seen a great deal of geography from the air, he opted for a degree in geography on the ground at the University of Nottingham in England. Later the offer of a scholarship from McGill University in the land of frozen tundra enticed him to Canada where he pretty much stayed for the rest of his life.2
But it was his job at Spartan Air Services in 1960 where the lightbulb went off. In Roger’s own words:
“In 1960, Spartan Air Services of Ottawa, Canada, was a large surveying and mapping company whose business included topographic mapping, geophysical surveys, land resources surveys, and other projects worldwide. […] George Brown, chief of Spartan’s land resources division, permitted me to try digital methods as a potentially cost-effective alternative. I created two small test maps in numerical coordinate form-each 5 x 5 inches and containing five polygons. I found that these could be digitally overlaid and that I could measure the resulting areas from the digital record. Efforts to interest Ottawa computer companies (Computing Devices of Canada, IBM, Sperry, and Univac) to partner with Spartan for future development were not successful. However, in 1962, at an ASPRS conference in Washington, DC, John Sharp, a consultant to IBM, introduced Spartan to the digital photogrammetric research being done at IBM in Poughkeepsie, New York, in the United States. That, along with subsequent contacts with the previously reluctant staff in the IBM office in Ottawa, was the beginning of a pivotal relationship that was to grow significantly over the years. IBM brought early experience with computers and programming to the table. I brought an understanding of the needs, as well as the geographical training needed to formulate the new concepts and to spell out the requirements for the system.”
And so, history tells us that it was in 1960 that the use of computers for geography was born.
But of course it didn’t stop there.
While on a flight in 1962 Roger struck up a conversation with the person seated next to him. That person turned out to be Lee Pratt who was the freshly appointed head of the Canada Land Inventory. Roger wasted no time preaching the early gospel of GIS to Lee and it all eventually led to the founding of GIS’s first church: the Canadian Geographic Information System (CGIS).
Meanwhile another victor was vying for history…
In 1963 a gentleman from Harvard, one Howard Fisher, got involved. He happened to have attended a talk by Professor Edgar Horwood of the University of Washington on computer mapping. Horwood was an urban planner, a pioneer and very much an unsung hero. For you extreme mapping nerds: he also founded URISA.
Fisher saw what Horwood was doing and thought he could do better.
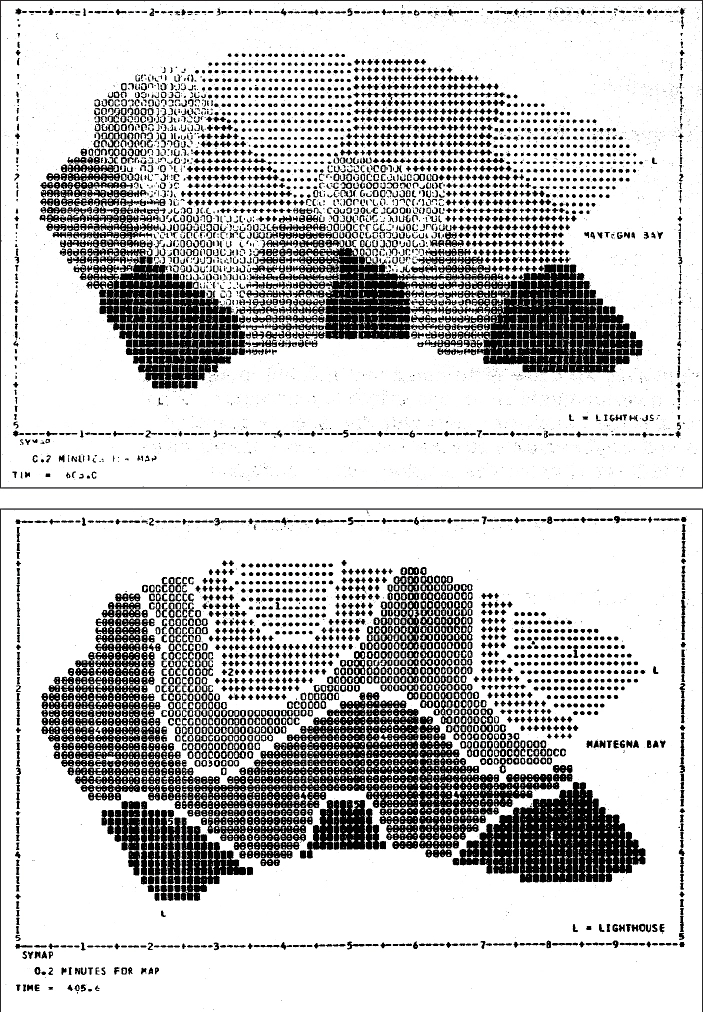
In 1965 Fisher convinced the Ford Foundation to issue a $294,000 grant to Harvard to found the Harvard Laboratory for Computer Graphics and anoint him as its Director. It was at this freshly minted lab that work on the Synagraphic Mapping System (SYMAP) was started. SYMAP claimed to be the first computer based mapping system that integrated geospatial analytics. But it was based on line printer technology.
“WTF is a line printer?” I hear you young ‘uns ask.
Well if you’re of that ilk and are curious to know: it is a printer that can print only characters, A-Za-z0-9 and maybe the odd symbol — but no emojis — one line at a time. No vectors. No arbitrary scribbles. No HD anything. Hell, it wasn’t even as advanced as a dot-matrix printer you’ll maybe see occasionally at one of those super advanced computer terminals that airlines insist on using.
So how the truck do you output a map with one of these contraptions? The answer is by controlling how and when the printer advanced to the next line and by a method of overprinting — i.e. printing on top of letters that had already been printed. In that way many different and glorious shades of black could be achieved.
The output from SYMAP looked like this:

Each of these outputs was derived from a computer ‘job’ that ran in batch mode. This meant your program was run by a computer operator wearing a white coat who lived in a room full of hot wardrobes that together comprised the computer. Your program was input using a stack of 80 columns cards with holes punched in them, all held together with an elastic band. Upon submitting your job to these high priest operators you were lucky if you got your printout in less than four hours. And that was if you didn’t have an error in your programming. Sometimes it would take dozens of submissions to work out the bugs, thus implying weeks before you got the results you were looking for.
But it was out of this lab that a number of companies were spawned. You may have heard of one of them: Esri. Or Environmental Systems Research Institute as it was initially known. At that time its founder, Jack Dangermond, was just a wee lad and was exploring digital mapping at the University of Minnesota. It was while he was at this university that he discovered an article about the Harvard lab and decided he must visit.
It turn out to be rather like the story of Jobs visiting Xerox Parc.
While at the lab Jack met Howard Fisher. Impressed by Jack’s work Howard spent the afternoon telling Jack about the Lab’s work — all while Jack’s wife, Laura, waited patiently in the car. “You’ve just got to work here!” Howard exclaimed, and so he did.
You can hear Jack tell the tale in this 6 minute video:
I think it’s interesting to note that if you look at the early history of using computers for mapping it was very different from other media revolutions. Take the transition from radio to TV for example. When it first came out broadcasters took a while to adjust to the new medium — early TV shows were simply modeled after radio broadcasts. It took a while to figure out that TV enabled entirely new kinds of programming.
You’d think it would have been the same with computer based mapping — i.e. computer programs would initially just be used to make printed map making more efficient. This obviously occurred (and still happens today). But due to the forethought and bright mind of Dr. Roger Tomlinson it was actually computer based analysis that took pole position.
Take Roger’s paper from 1962 for example, “Computer Mapping: An Introduction to the Use of Electronic Computers In the Storage, Compilation and Assessment of Natural and Economic Data for the Evaluation of Marginal Lands“. In this paper, Roger makes the case for using computer based spatial analysis for figuring out the best use for less than fertile lands across Canada. So right from the get-go Roger caught on to the amazing promise of geospatial analytics.
The Harvard lab cottoned on too. Three years after its original founding in 1968 they renamed the lab from “The Harvard Laboratory for Graphics” to “The Harvard Laboratory for Graphics and Spatial Analysis”. No mention of ‘geo’ yet, but they were getting closer.
As I said at the start, history is told mainly by the victors. Esri, the global powerhouse of commercial mapping technology, has taken the lead in giving reverence to Tomlinson and the Harvard lab. And rightly so.
But it all makes me wonder… was there another researcher somewhere around the world who was thinking along the same lines? Did she or he have the foresight to realize the immense possibilities of what computers could bring to mapping and geospatial analytics? But did they lack the funding, the resources or the recognition? Professor Horwood is certainly one chap who deserves more credit.
The untold history may remain forever a mystery.
Footnotes
1 Three letter acronym
2 The exception was that in 1974 Roger Tomlinson got his doctorate from University College London
Acknowledgments and References
- “Charting the Unknown: How Computer Mapping at Harvard Became GIS” by Nick Chrisman
- “Beginnings of Geodesign: A Personal Historical Perspective” by Carl Steinitz
- “How Advances in Computer Mapping Shaped the Early Days of GIS” by Greg Bruce
- History of URISA — URISA
- Roger Tomlinson Obituary
- “The Hollerith Machine” – U.S. Census Bureau
- “Roger Tomlinson – The Father of Computerized Cartography“by Rick Boychuk, The Globe and Mail
- “In Memoriam: Roger Tomlinson – “The Father of GIS” and the transition to computerized geographic information.” — Photogrammetric Engineering and Remote Sensing Magazine, May 2014
