This jaded mapping curmudgeon has been in the industry a good few years and as a result has witnessed a few mapping epochs — the dawn of global digital street maps, the dawn of internet mapping and the dawn of mobile mapping to name just a few.
Coupled with that I’ve seen the tools to make maps evolve too. Back when I was a wee spotty-faced lad there were no off-the-shelf software products that could be used to create maps bigger than a postage stamp. So you had no other option but to write your own map editing software.
This stayed the same way for decades and is still much the case today. Those serious about creating a global map have continued to develop their own map editing tools1 Meanwhile off-the-shelf map making tools have lurched forward glacially. People publishing paper maps commonly used Adobe Illustrator to create their masterpieces. Individuals that had a desire to flagellate themselves with more insidious tools used offerings from the likes of Esri, Intergraph and Smallworld. Here you had to spend copious amounts of time and energy learning about an insanely long list of things like feature layer views, integrated mesh layers and composite relationships. Yes, dear readers, these are the tools for true mapping “professionals” and not for the feint of heart.
So to use a Jobsianesque term, what about “Mapping for the Rest of Us?”
Behold: “The Simple Map Happenings Challenge”
So to answer this question of “Mapping for the Rest of Us” let me propose “The Simple Map Happenings Challenge”.
It comprises two parts involving the creation of two very basic maps:
- Part 1: A map that shows the location of a bunch of addresses
- Part 2: A color coded map that shows sales by US states
It’s 2023, so you’d think this would be easy, eh?
Well let’s have a little poke around shall we?
Esri
These are the big boys in the mapping tool industry. Similar to Adobe in the desktop publishing world, Esri has basically bludgeoned every other significant competitor into oblivion. And they’ve made some great efforts to try to make their software easy. So let’s give their stuff a whirl.
I’ll start at Esri.com and see where it takes me:
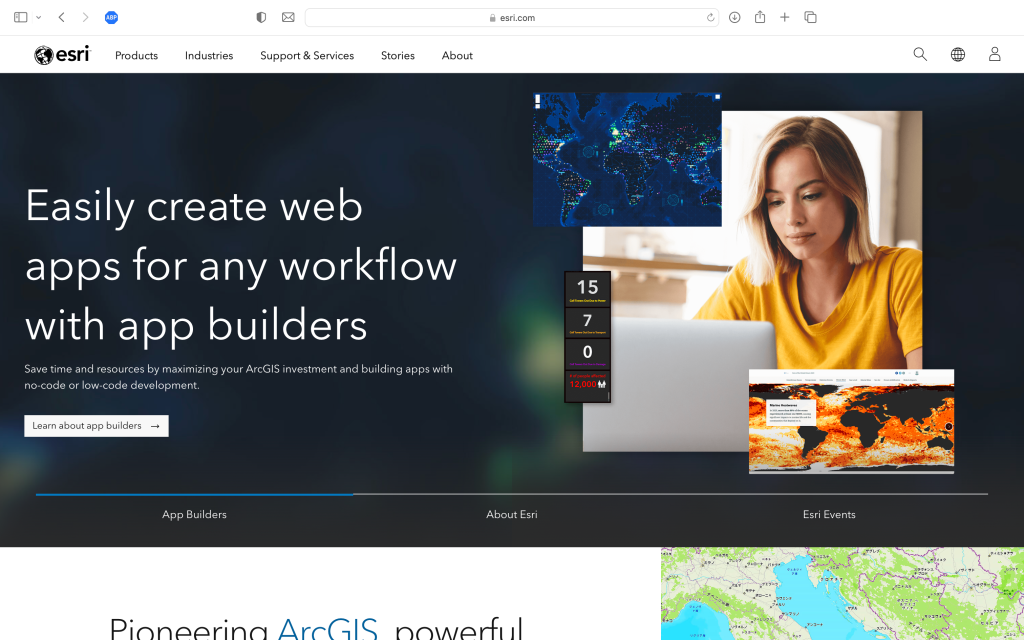
Hmm. “Easily create web apps for any workflow with app builders”. Not what I’m looking for. Like most people only the planet nowadays when I need to find something I don’t waste my valuable time poking around on web pages. Instead I start with a search. So let’s do that shall we?
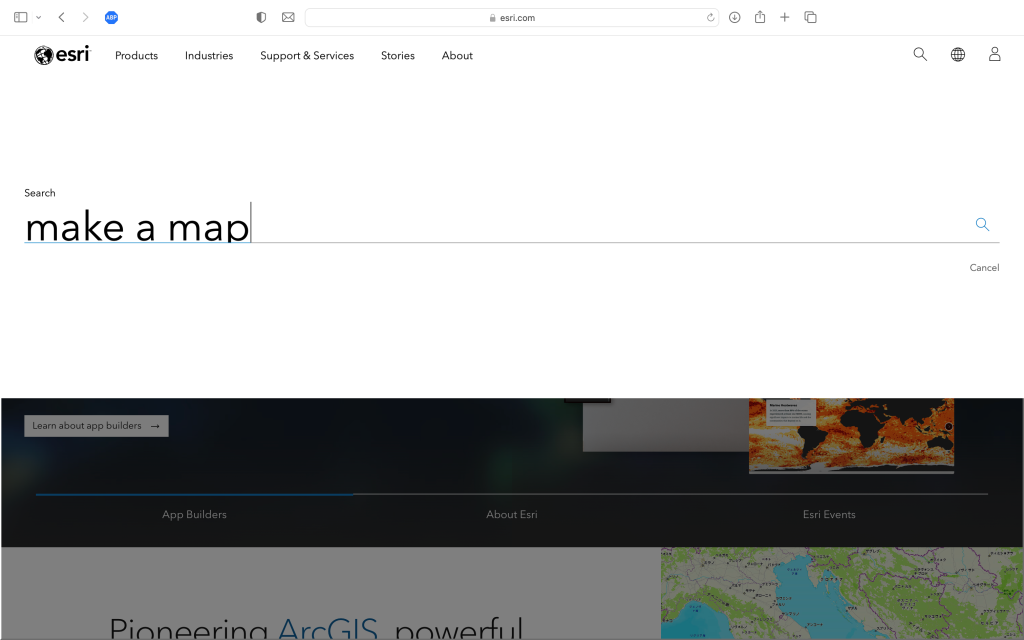
My attempts to search for “make a map” are immediately thwarted. At Esri apparently I’m only allowed to search for “make a mao”. Oh well, let’s see where it takes me:
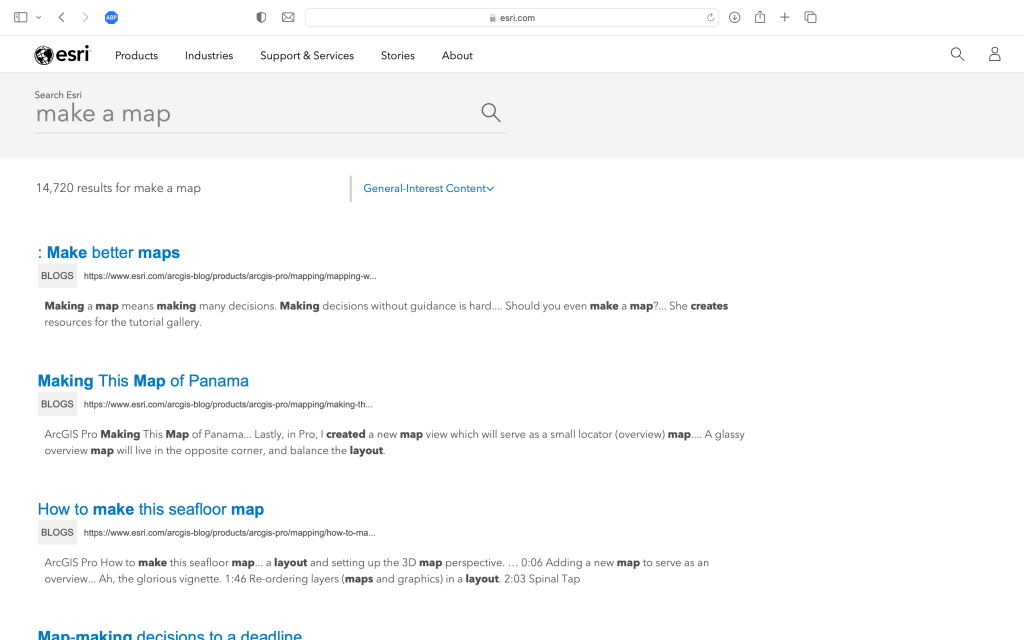
Hmm, a blog about “: Make better maps” or how to make maps of Panama or seafloor maps still aren’t exactly what I’m looking for. Perhaps I’ll have to resort to a dreaded page crawl. Let’s look at the Esri product page:
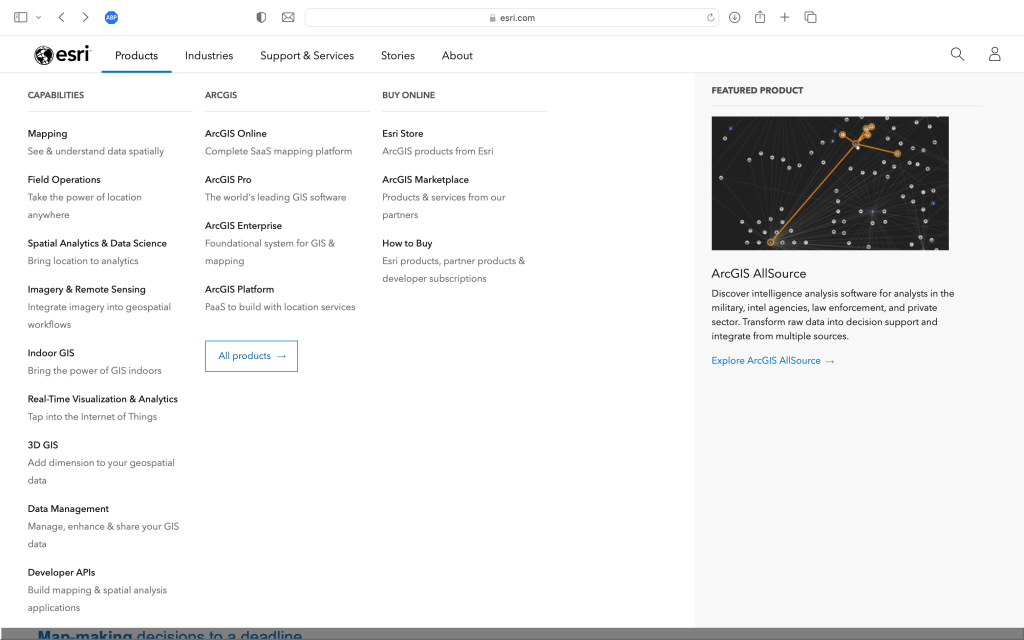
Eureka! There it is! Something called “Mapping”. That looks very promising. Let’s dive deeper:
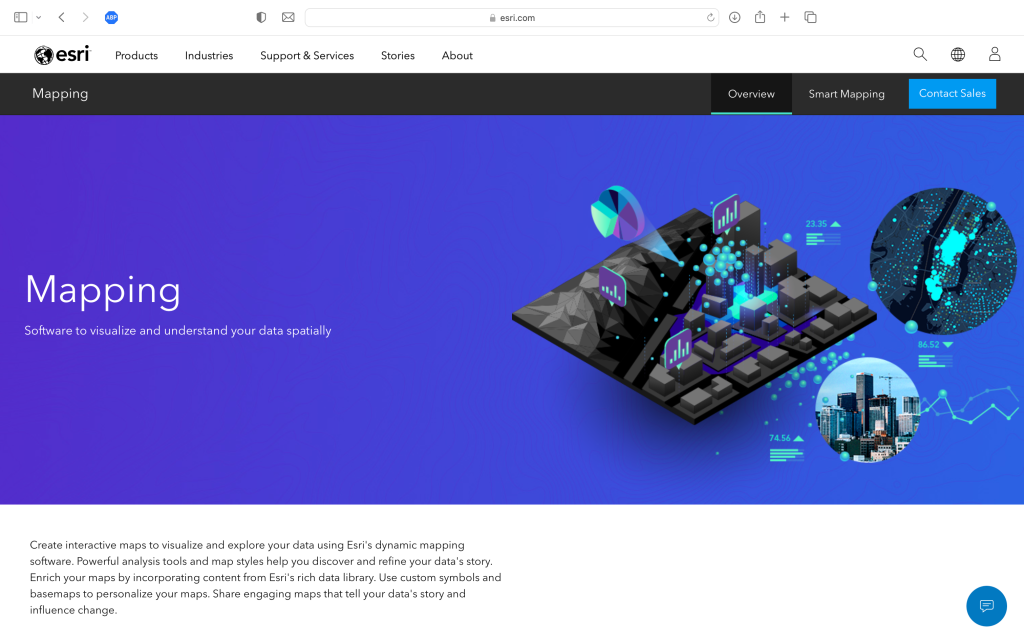
Bingo. “Mapping. Software to visualize and understand your data spatially”. And boy, look at those beautiful map illustrations! I’m now ravenous to dive in. Alas, I quickly become disillusioned and depressed. Scrolling down this page all I can find is information about what the software can do and a few interactive examples. Nowhere can I find a link to make my own map.
But then, I suddenly notice I missed what seems to be a possibly perfect tab: “Smart Mapping”. And it comes with a similarly perfect promise: “Quickly create beautiful and informative maps”
Could this finally be what I’m looking for?
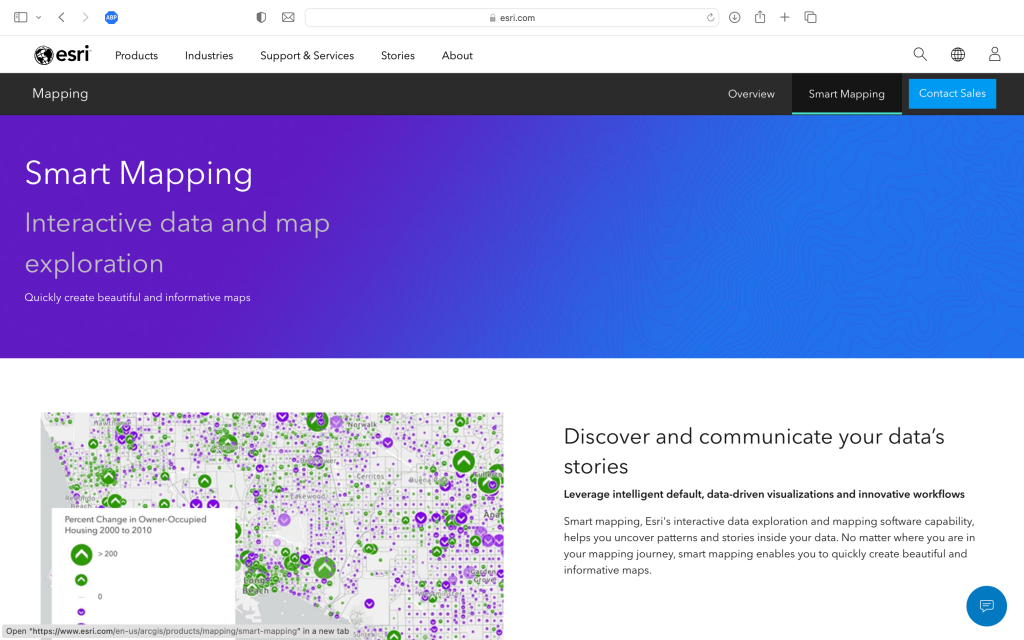
I scroll down the page with bated breath. Finally I get to it … “Start mapping and understanding your data”. Yay!
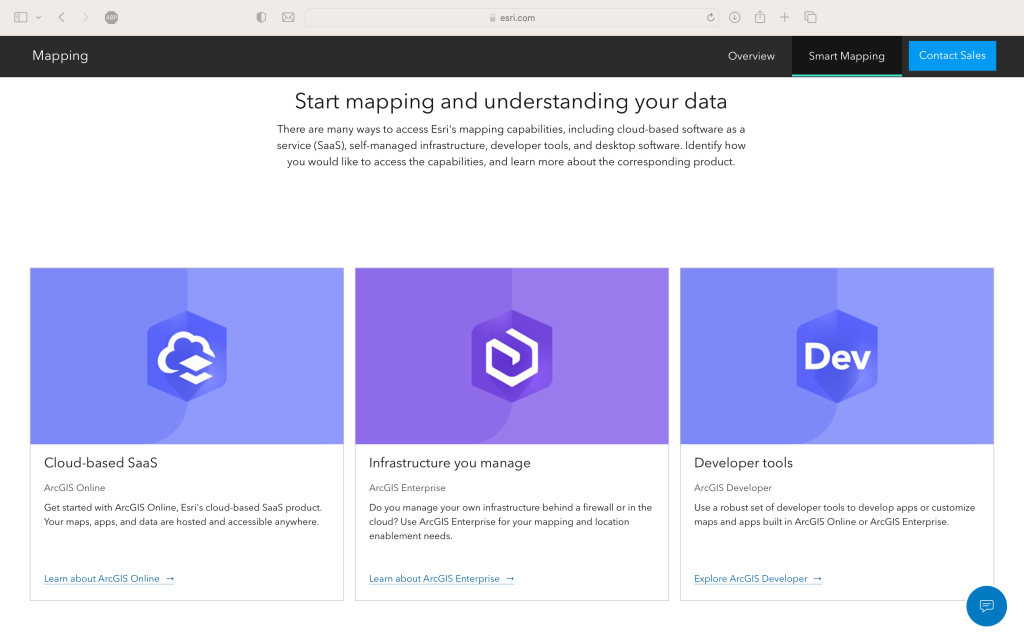
But wait. What is this “Cloud-based SaaS” and “Infrastructure you manage” and “Developer tools”? I just want to map my addresses and show my sales by region. None of those options seem like the ticket. After further doom scrolling a bit further I get to …
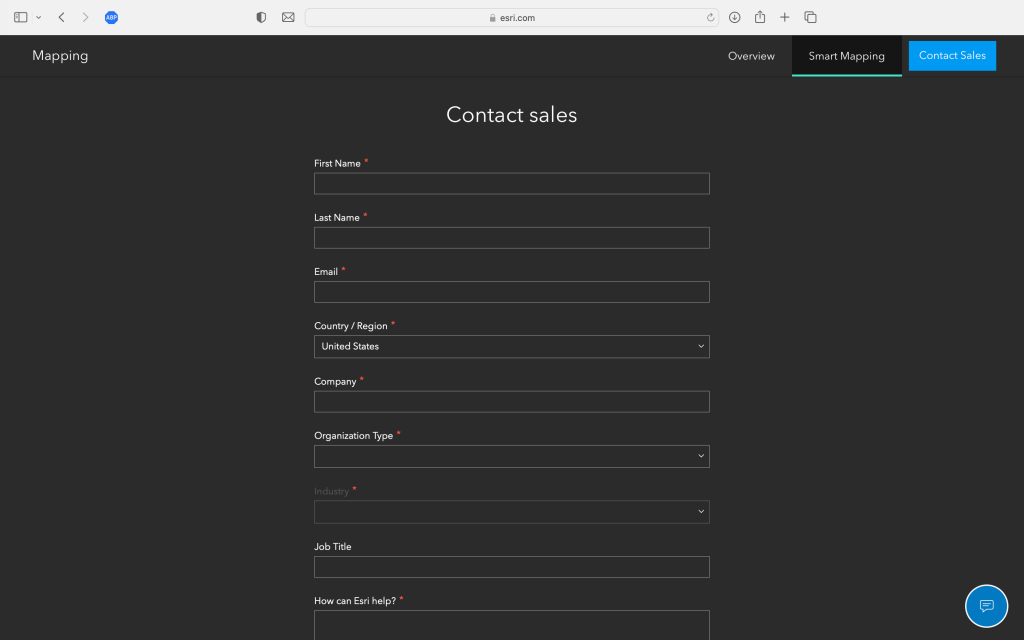
Really Esri? You want me to talk to a salesperson? I’m sorry, but that’s not really today’s way of doing business. I think I’ll have to move on to other options 2.
So the folks at Google have been mapping for a while. I think they’ve been doing it long enough to qualify as a mapping organization, don’t you?
Their namesake product doesn’t allow you to create maps, but googling “make a map” quickly directs you to Google’s My Maps product:
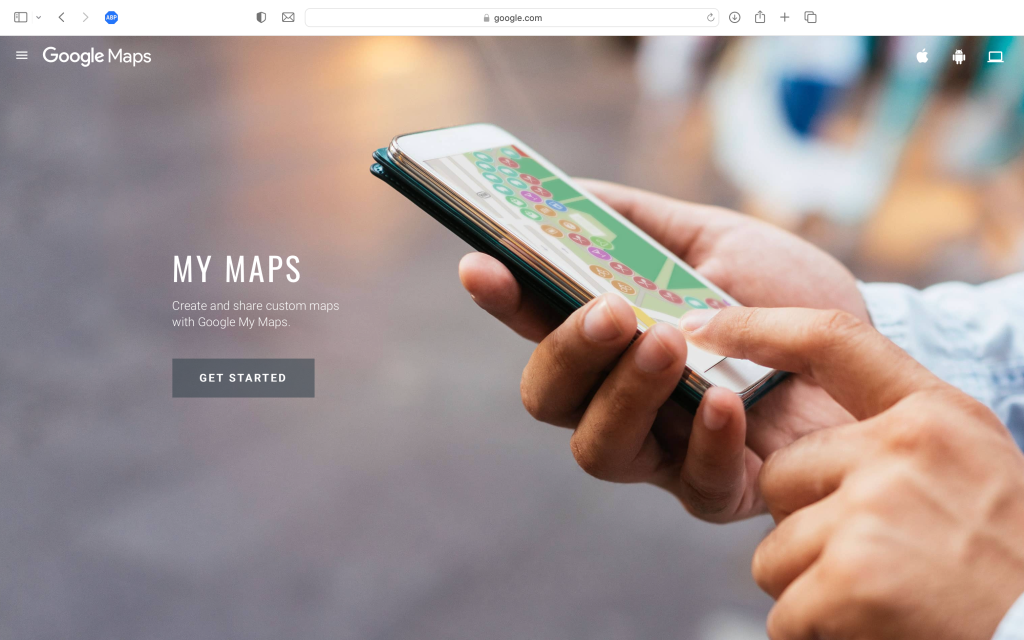
Looks promising! Let’s get started:
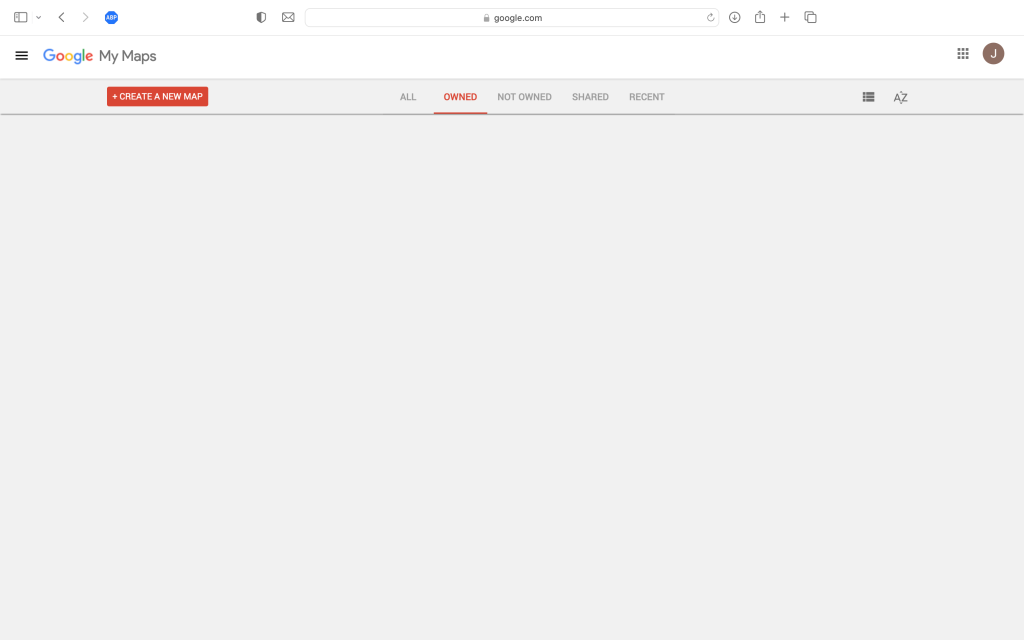
Ooh! A simple “Create a New Map” button! Let’s click and see what happens…
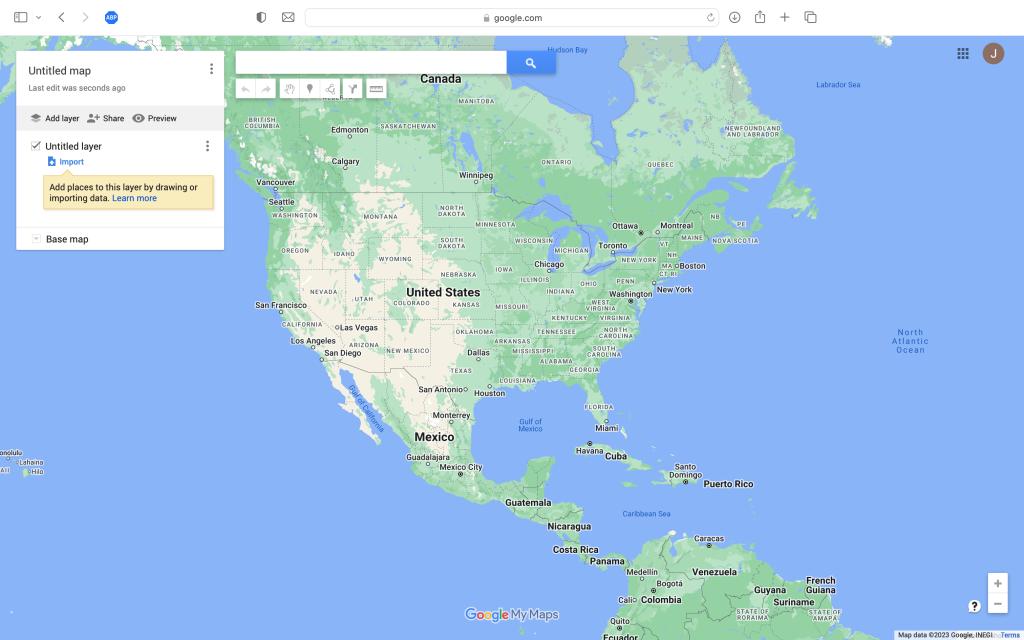
A somewhat tiny invitation to “import” data. Ok. I think I get it. Let’s try that:
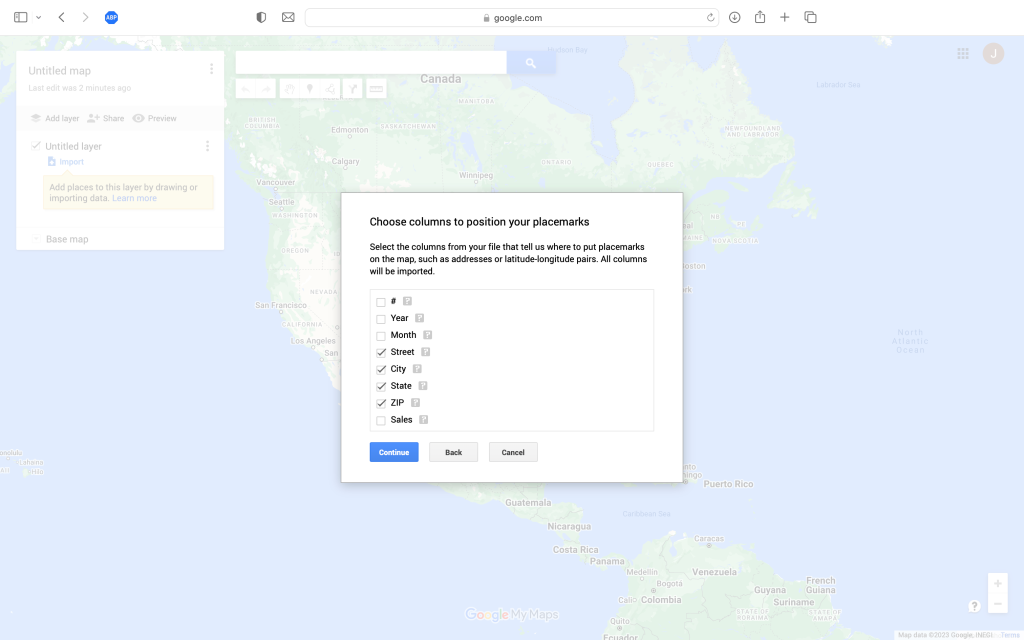
Hey it’s seeing my little spreadsheet and asking me about columns to “position my placemarks”. Kudos for not using geographically insidious terms such as “geocoding”.
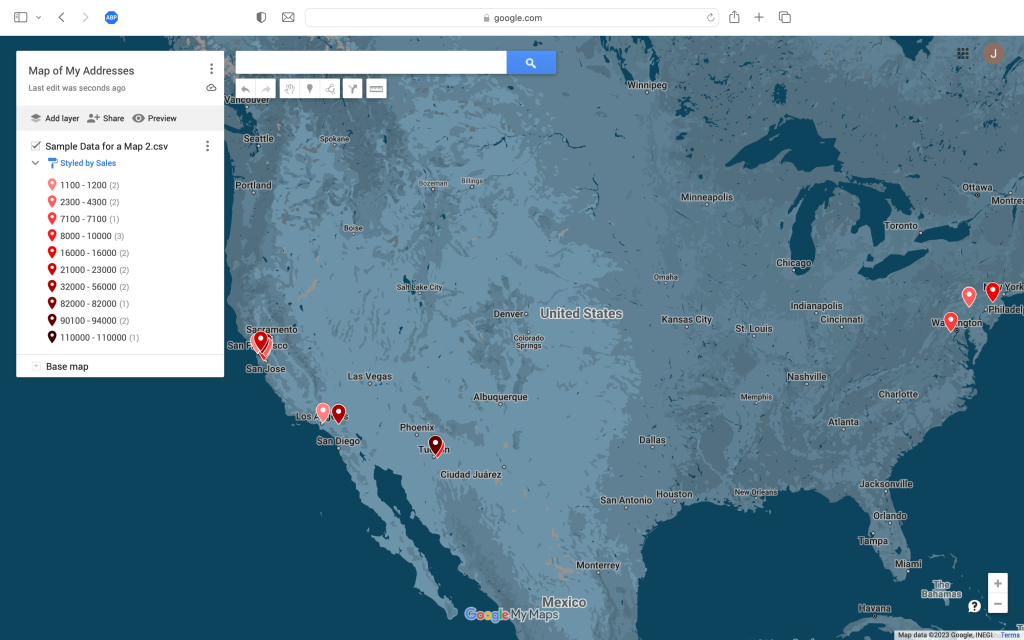
Moving on and with a little tweaking and not too much gnashing of teeth I get my map and I even manage to color code the pins by sales range. But alas, I fail Part 2 of the Simple Map Happenings Challenge: I can’t find a way to create a color coded map of my sales by US state. Grr.
Apple
Apple has “make a map” tools?!!
No, you’re right, it doesn’t.
Carry on…
Felt
Felt? Who the hell is Felt?
Well Felt, dear readers, is a newcomer to the scene. They have an entirely web based product that is aiming to take out all the complexity of mapping and make it super easy. Let’s take it for a spin:
Here’s the main site. Now let’s try to see if it’s up to the Simple Map Happenings Challenge…
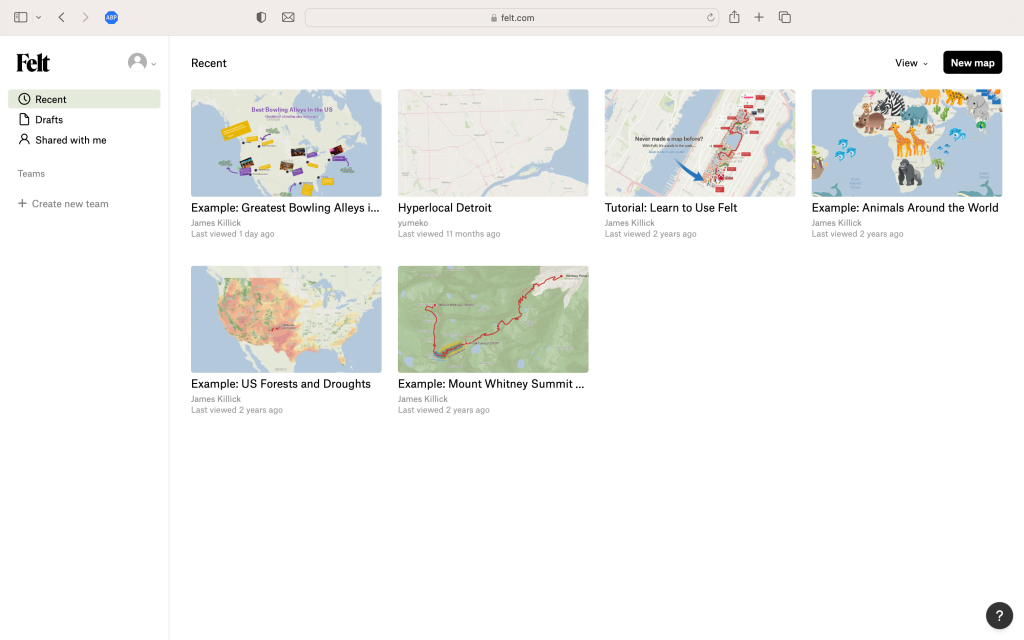
Ok — they give me some nice examples and there’s the “New Map” button. Let’s click it and see:
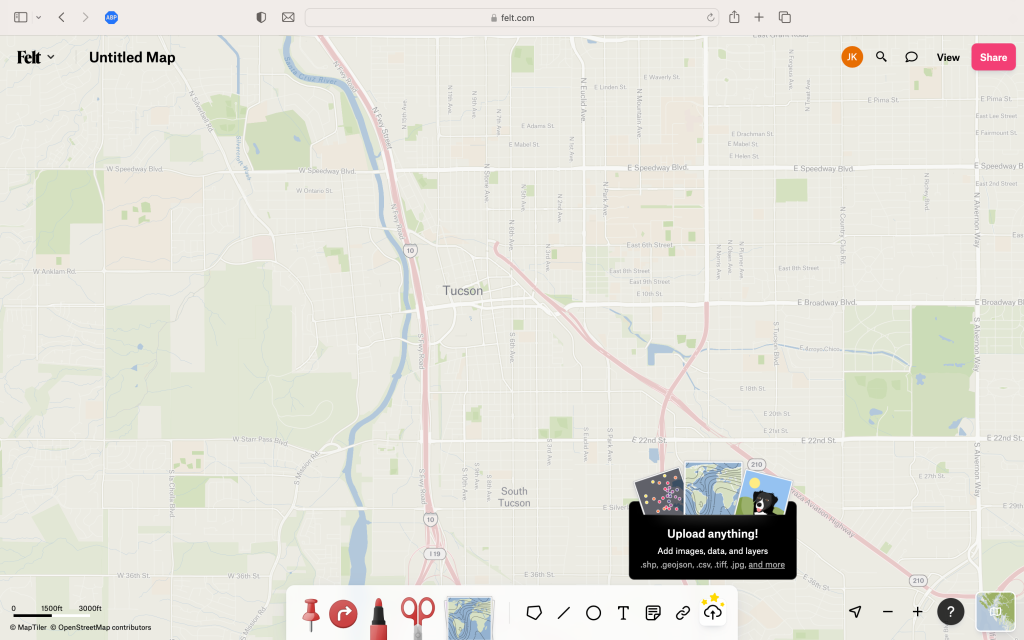
Ooh! Upload anything? That looks promising!
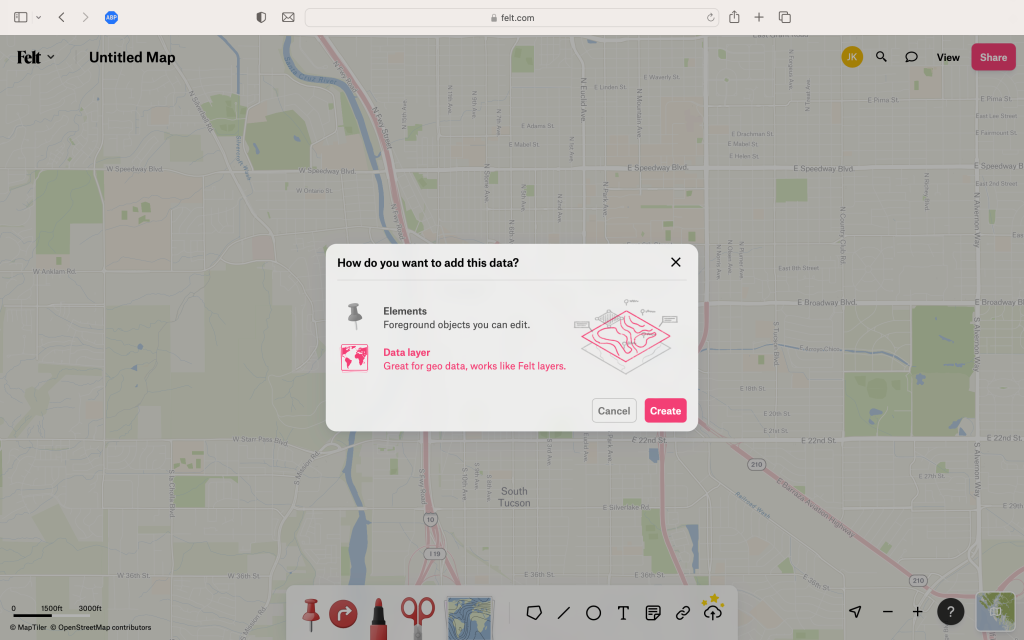
Hmm. Do I have “elements” or “data layers”. I’m not sure. Let’s try data layers…
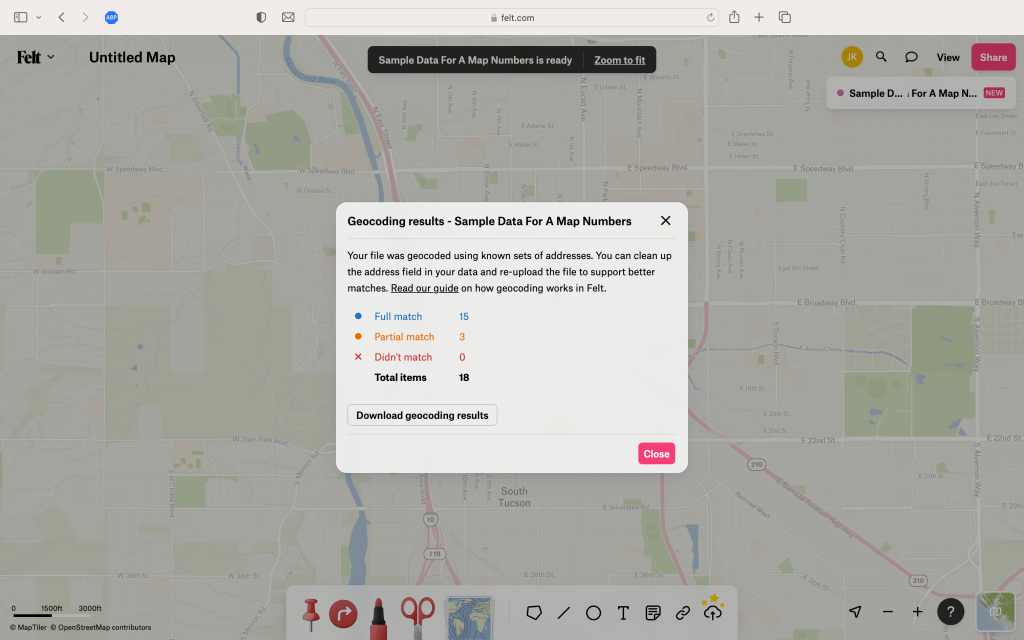
Uh oh. Felt can’t seem to find the location of three of the addresses. That’s weird, ‘cos Google had zero problems…
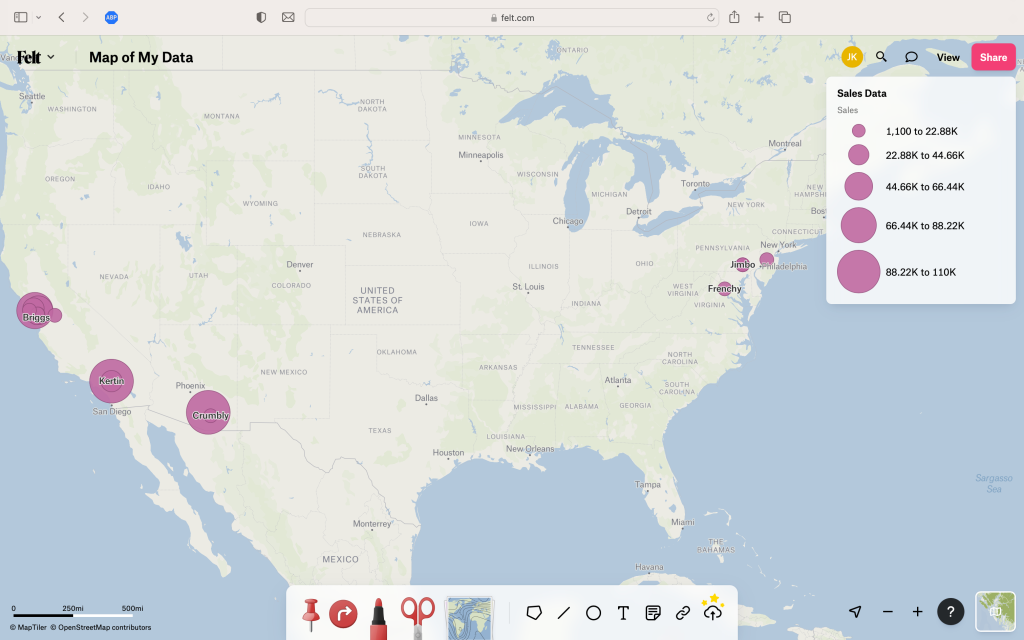
Well similar to Google I’m able to map the sales data, but this time I can make different sized circles based on sales volume. But surely there must be a way to create a color coded map by state? Let’s use help and search for it:
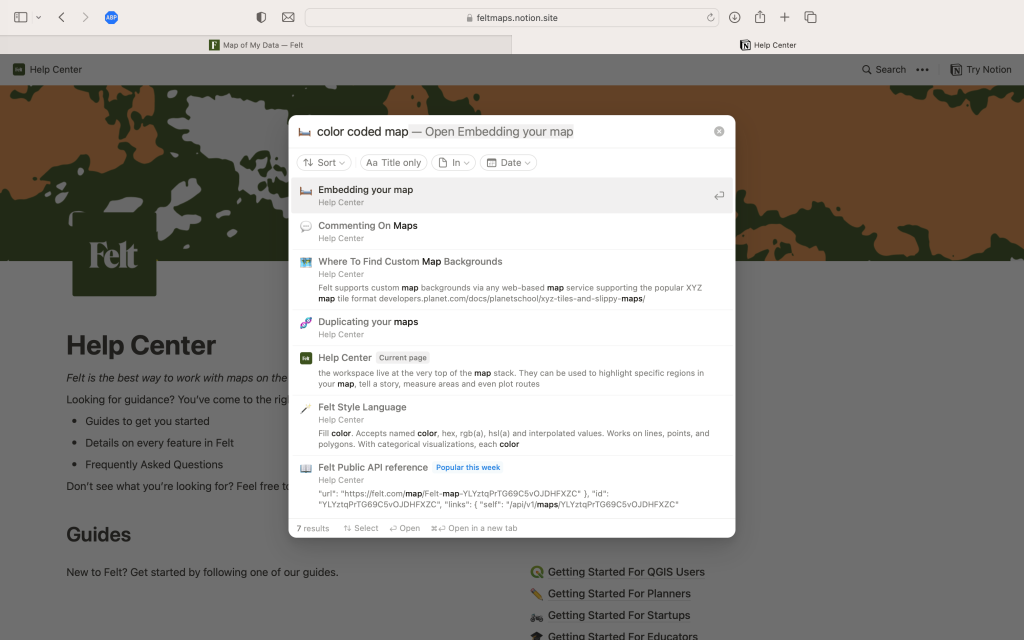
Well none of those answers look useful. Given all those sexy examples Felt showed, it must be possible to create what I want, but I can’t find it. Like many real customers might do… I’m going to give up and try something else.
Microsoft
Wait what? Microsoft does mapping?
Well it turns out they do, and they do it inside Excel. Sounds too good to be true, but let’s give it a try.
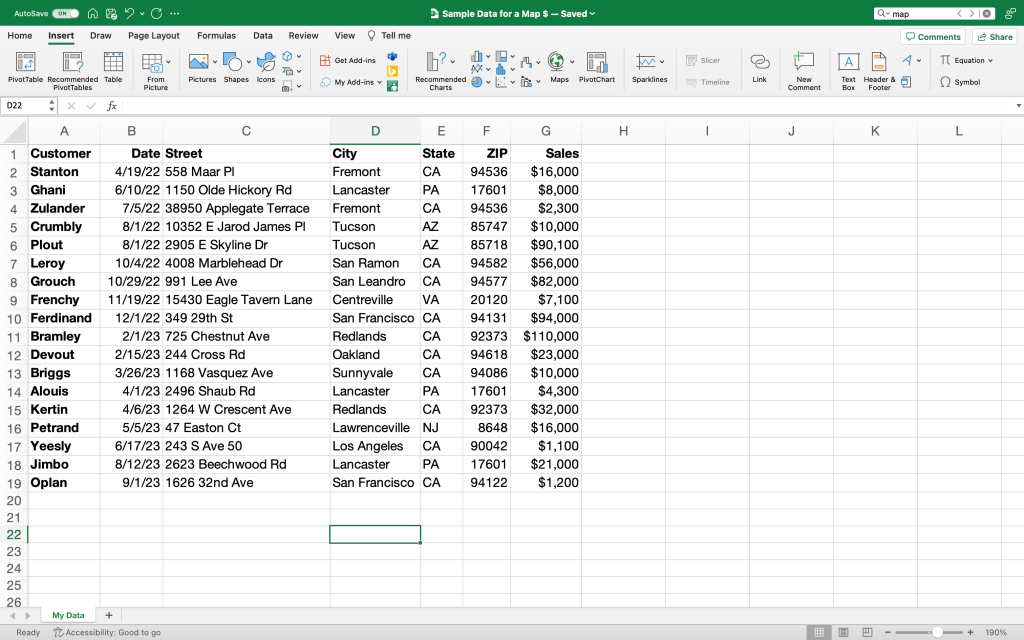
Here’s my little spreadsheet. If you look closely you’ll see something rather special embedded in the ‘Insert’ menu in Excel:
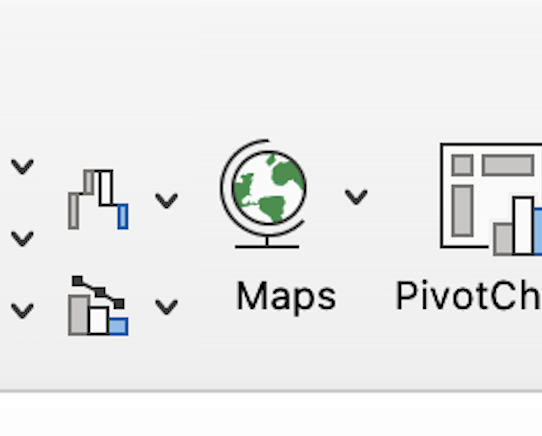
Whoa! Let’s try clicking it to see what happens:
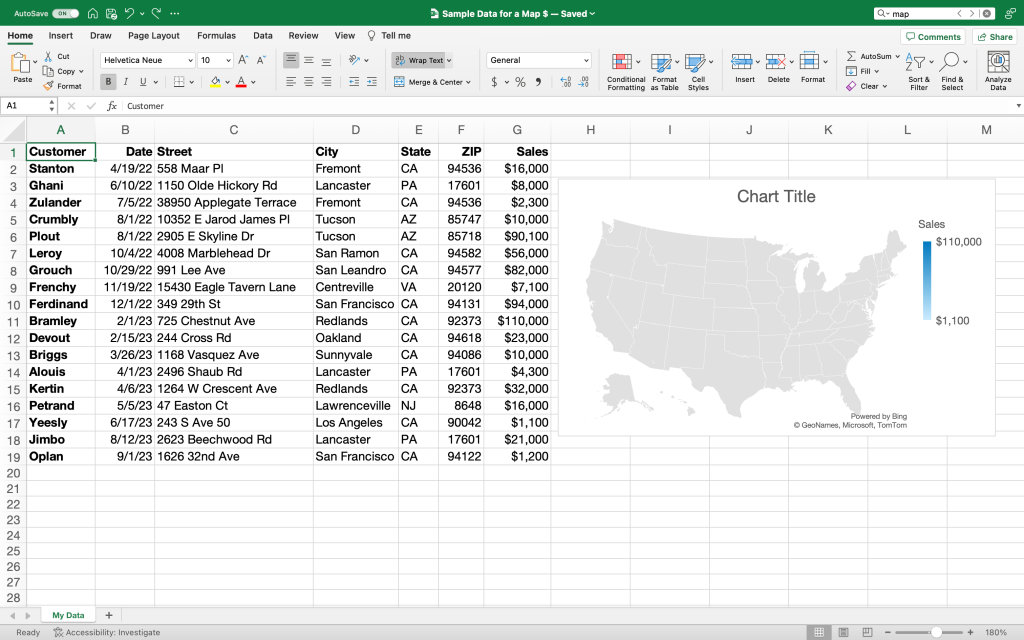
Wow. It automatically figured out my data was for the US and created a legend for my sales. But whither my color coded sales by region map? For that I’ll have to do more poking.
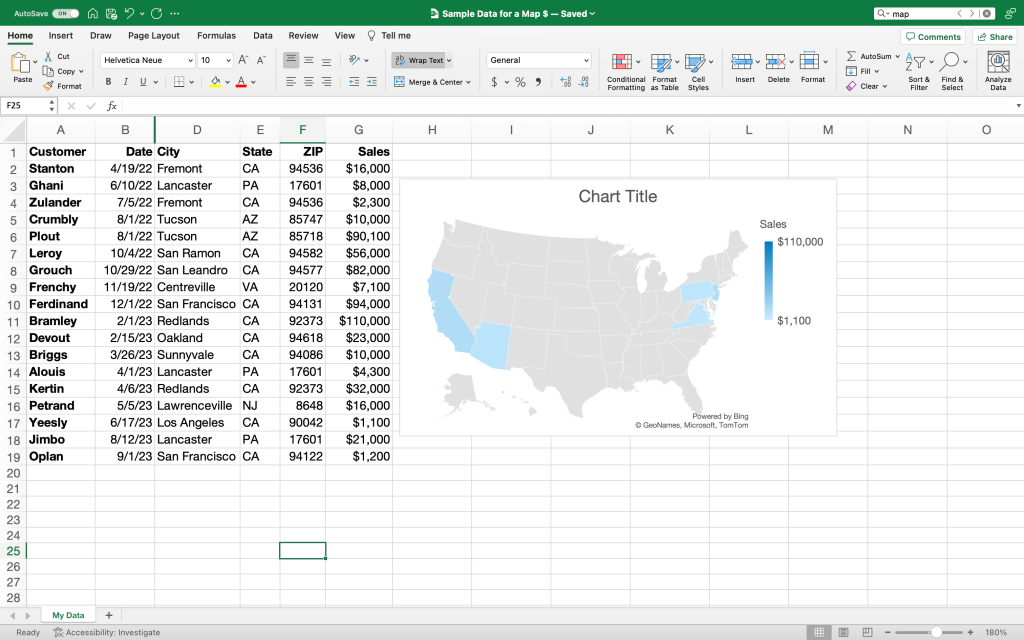
After much jabbing I came upon a counterintuitive solution: if you hide the addresses — bingo — Microsoft (of all companies!) solves Part 2 of The Simple Map Happenings Challenge. It displayed a lovely color coded map of my sales by state.
But alas. It’s a pokey static map. I can’t pan it or zoom it. And where are the addresses? It doesn’t seem to know what to do with them.
In fact not only does it not show the addresses on its pokey map, if I unhide the addresses in the spreadsheet it promptly rewards me by telling me that I can go take a flying leap and, screw you, I’m not going to show you the color coded map anymore.
Thanks Microsoft.
But There is Another Option…
Perhaps I was a tad unfair to Esri because they do have a product that might suit my needs. But in deference to my example above, they really don’t make it particularly easy to figure out how to get to it.
However, not all is lost. You see having being a former Esriite I have insider information. At Esri they have an (over?) abundance of products and 99% of them happen to be prefixed with ‘ArrghGIS’, err, sorry, I mean ‘ArcGIS’. It turns out that’s also another top level domain that Esri owns and it’s a key one in fact. So key that it may be the answer to the epic quest. Let’s give it a try:
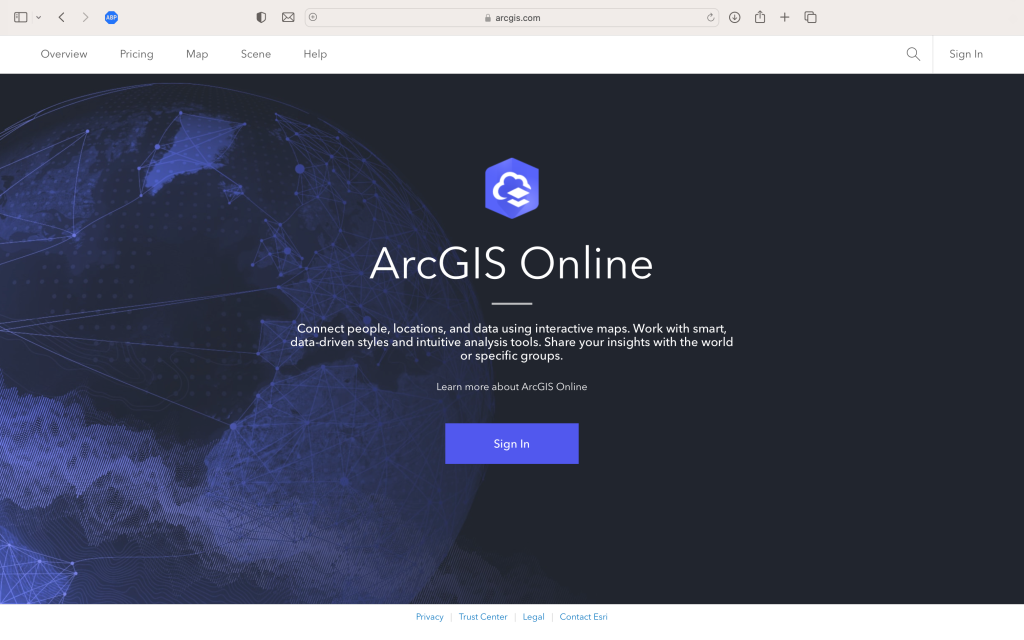
You’ll note the tab marked ‘Map’ and I’m sure you’ll immediately think it looks like the winning ticket. But not so fast. I won’t bore you with the details but it turns out if you take that path you will find it to be a fool’s errand. If you use the free unauthenticated mapping tools in ArcGIS you’ll find it won’t let you import or upload data. No, dear readers, you have to sign up for a free trial (and later pay your pound of flesh). So free trial it is:

And with that you are welcomed with a lovely message. And not only that — a simply scintillating button: ‘Make Maps in ArcGIS Online’. Woo hoo!
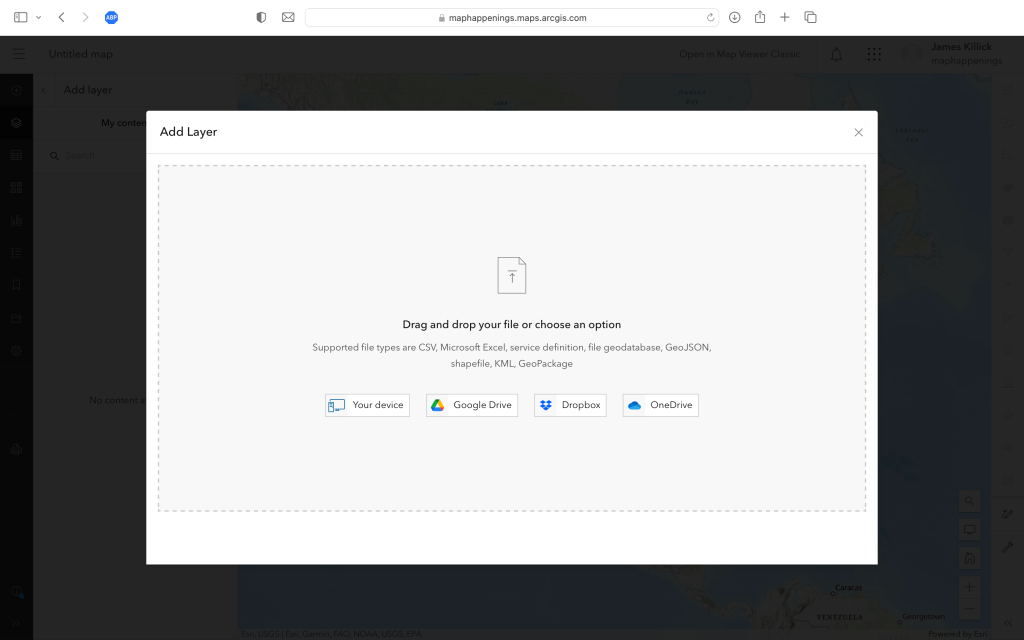
Now I can see that I can finally upload my data! Let’s try:
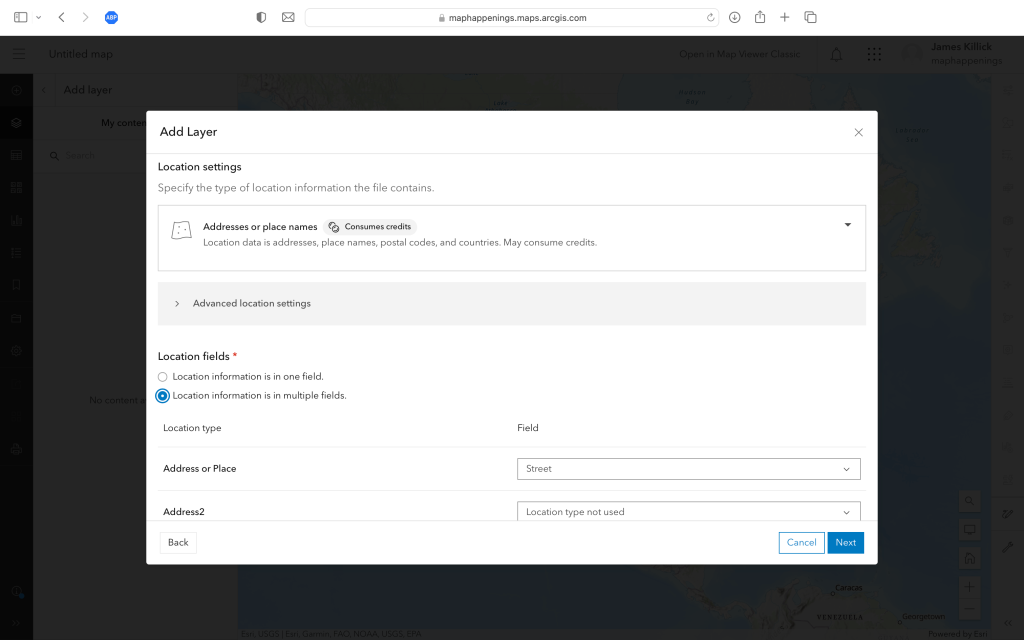
Ok pretty good so far. It’s a similar interface to Google to identify the fields that have the address information — but it’s actually more pleasing — and, so far at least, no mention of insidious terms like geocoding. Amazing! Within a few short moments I get…
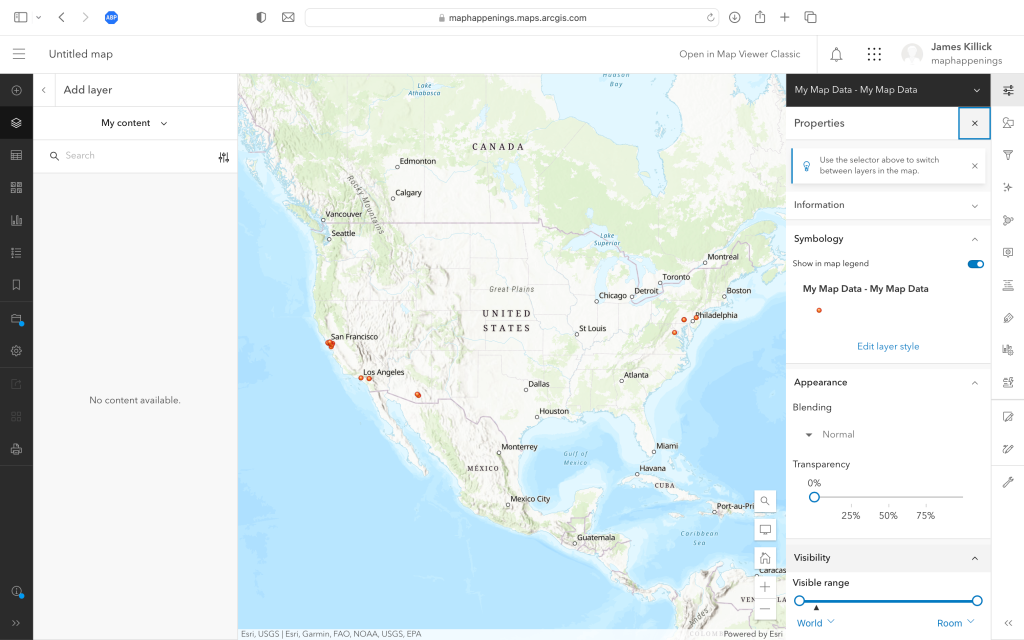
… a map of all my addresses. Yay! Part one of the Simple Map Happenings Challenge is solved. But what about Part 2? Well with a bit of poking around I get to this:
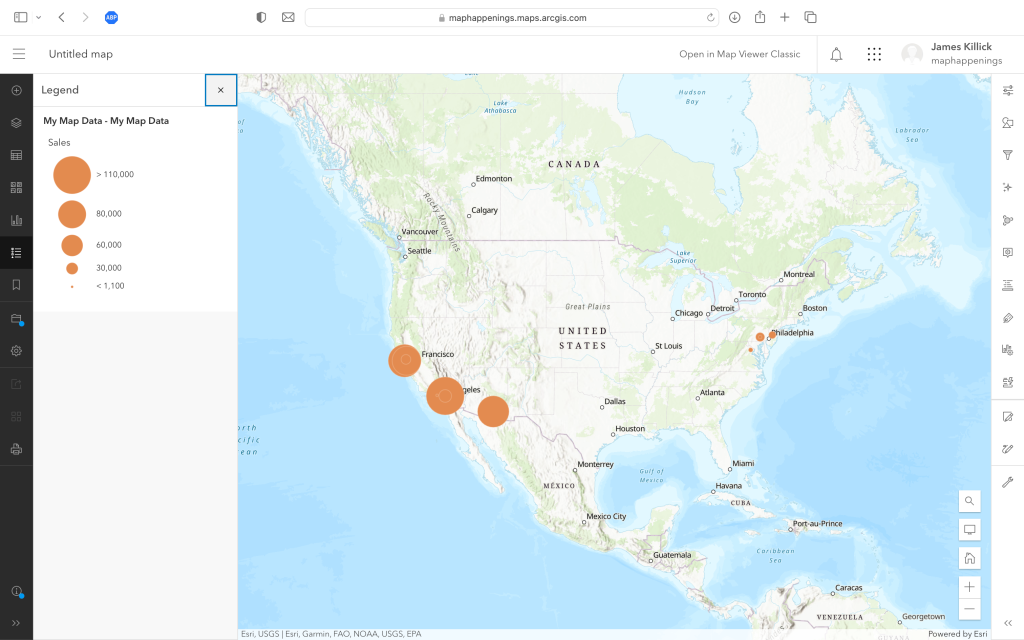
So, similar to Felt, and with not too much gnashing of teeth, I am able to change the map to show different sized circles based on sales volume. But can I solve Part 2 of the Simple Map Happenings Challenge and create a simple color coded map showing sales by state? Please forgive me while I grind away…
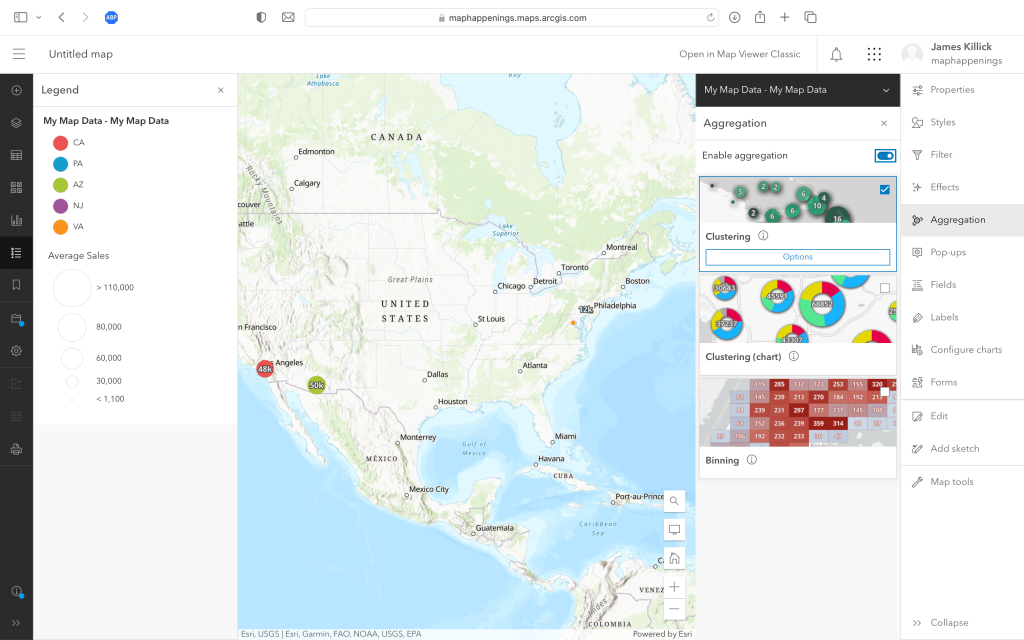
After some relentless clicking, tapping and spelunking I managed to get to the point shown above. Just like with Felt, I know there is most definitely is a way to create color code maps of regions, but frankly I’m stumped. As you can see I’m deep into the dark bowels of Esri technology, having discovered clustering and binning, but not choroplething.
So After All That…
Is there anything else? Well I should give a shout out to the folks at MapIdea. A little like Felt they’re on a mission to make mapping easy, in their case mapping for business analysis use cases. And they show a great video on their web site on how to create maps of sales by region. Here it is:
Alas, MapIdea has yet to integrate that nefarious process of geocoding3 into their product, so they can’t solve Part 1 of the Simple Map Happenings Challenge. When they eventually do, they”ll definitely be worth a very close look, ‘cos they’re doing some great work!
If you do some googling you will find some other products that claim to do simple mapping. But the point of today’s post was not to go down that rabbit hole.
No, dear readers, it was to make a very simple point: the big boys and girls — with all that knowledge, history and expertise — still have a lot more work to do.
- Examples include Etak > TeleAtlas/GDT > TomTom, Karlin & Collins > Navigation Technologies > Navteq > HERE, ZENRIN, Google, Apple ↩︎
- Yes, I know, I know. I should have clicked on that thing called “ArcGIS Online – Complete SaaS mapping platform”, but it was that simple term — “Mapping” — that caught my eye and led me down a dead end path. ↩︎
- In layman’s terms: that process of being able to locate a place or an address on a map. ↩︎
